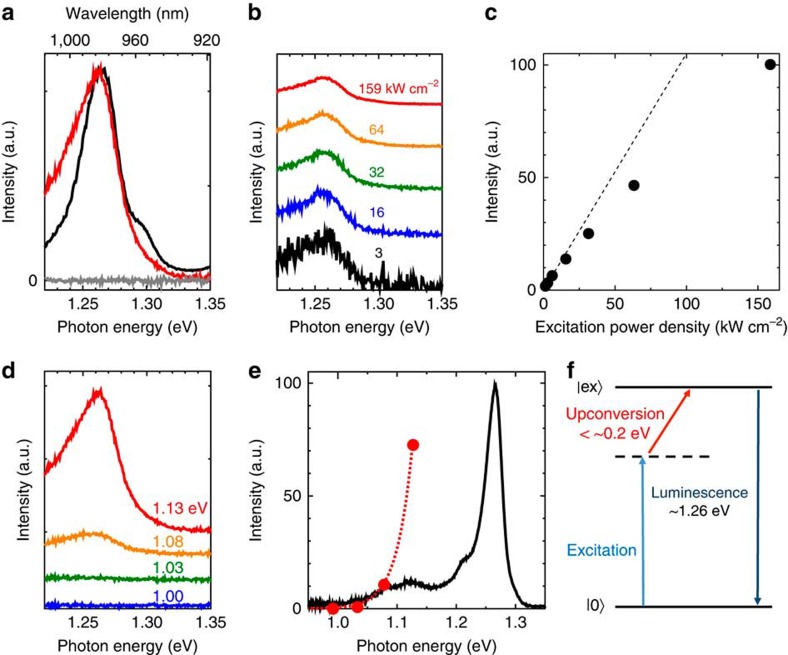
Figure 2. Excitation power and energy dependences of the up-conversion photoemission.
(a) Photoemission spectra of carbon nanotubes excited at incident photon energies of 1.13 (1,100 nm, red curve) and 2.18 eV (568 nm, black curve). The gray curve is a spectrum taken for a carbon nanotube-free surfactant solution excited at 1.13 eV for comparison. The intensity was normalized so that the noise level appears to be comparable to the spectrum of carbon nanotubes excited at 1.13 eV (red curve). The excitation band width was 10 nm. (b) Excitation power density dependence of photoemission spectra excited at 1.13 eV. The spectra for excitation densities from 3 to 159 kW cm−2 are shown. Each spectrum is normalized by corresponding excitation power density. (c) Photoemission intensity (from data shown in b) plotted as a function of excitation power density. The dotted line corresponds to linear function for comparison. (d) Excitation photon energy dependence of the photoemission spectra. In b and d, each spectrum was vertically shifted for comparison, and corresponding excitation power densities (for d) or excitation photon energies (for d) are indicated on each spectrum for clarity. (e) Up-conversion photoemission intensity (red circles, from spectra in d) as a function of excitation photon energy, plotted together with normal photoluminescence spectrum at an excitation energy of 2.18 eV (black curve) for comparison. The dotted red curve is a guide to the eye. (f) Energy diagram for the observed photon up-conversion processes. Solid lines represent the ground (|0>) and free exciton (|ex>) states in carbon nanotubes. The dashed line corresponds to an intermediate state in the up-conversion process.

