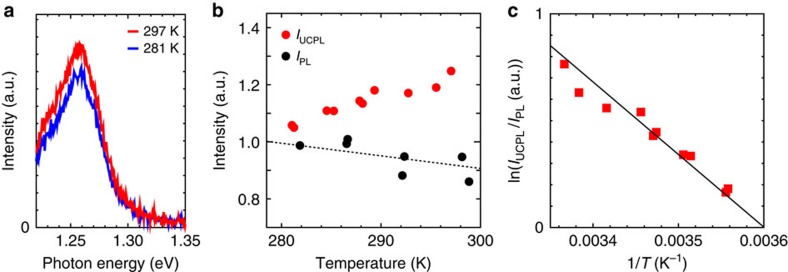
Figure 3. Temperature dependence of the up-conversion photoluminescence.
(a) Up-conversion photoluminescence spectra at 297 (red curve) and 281 K (blue curve) for an excitation energy of 1.13 eV. (b) Up-conversion (red circles, excitation energy=1.13 eV, IUCPL) and normal photoluminescence intensities (black circles, excitation energy=2.18 eV, IPL). The temperature-dependent normal photoluminescence intensity is fitted with a linear function (dotted line), which was used to normalize the up-conversion photoluminescence intensity at each temperature in c. (c) Arrhenius plot of the up-conversion intensity (IUCPL) normalized by the normal photoluminescence intensity (IPL) at the corresponding temperature (red squares). IUCPL was divided by IPL to account for the temperature-dependent variation of IPL. The black solid line represents the Arrhenius equation for an activation energy of 120 meV.

