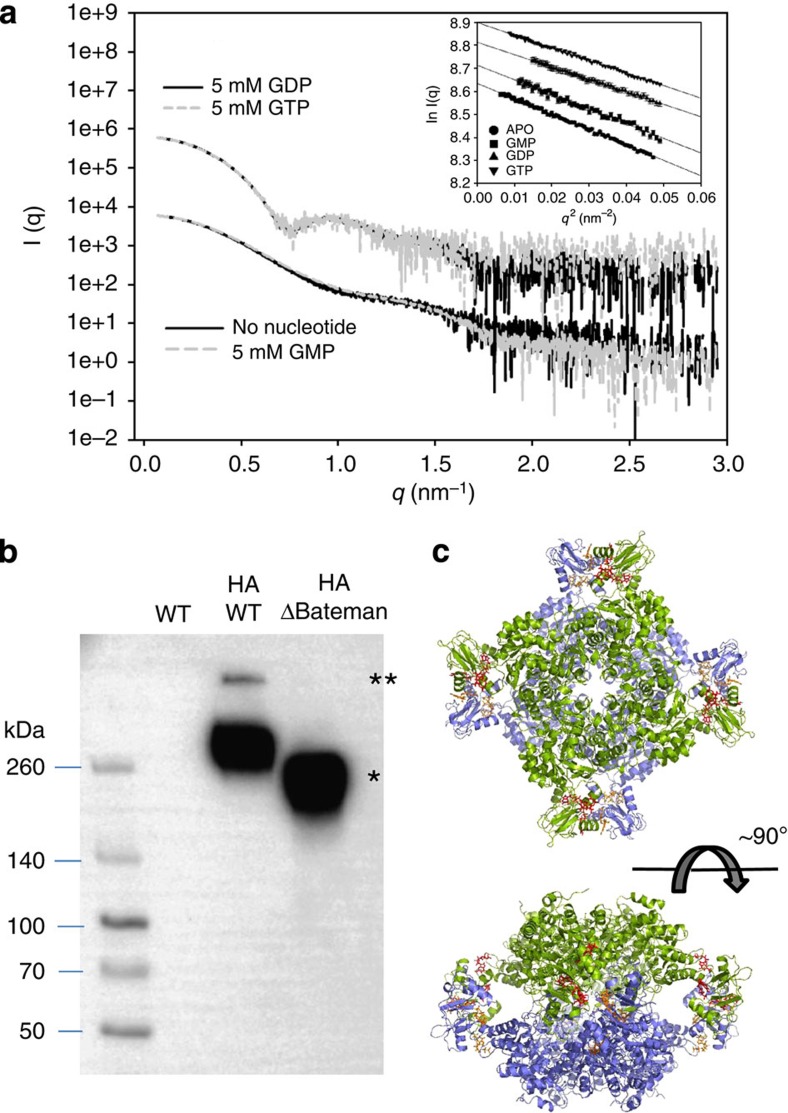
Figure 2. GTP and GDP alter the quaternary structure of AgIMPDH.
(a) SAXS profiles of AgIMPDH in the presence of different nucleotides. The inset shows the Guinier plots for the different curves. The plots have been conveniently displaced along the y axis to facilitate visualization. (b) Anti-HA western blotting of cross-linked A. gossypii whole-cell extracts. The single and double asterisks show the bands unambiguously attributed to tetramers and octamers, respectively. (c) Different views of a cartoon representation of AgIMPDH octamers, obtained in the presence of GDP (red and orange sticks). The two tetramers that pile up tail-to-tail are coloured green and blue.

