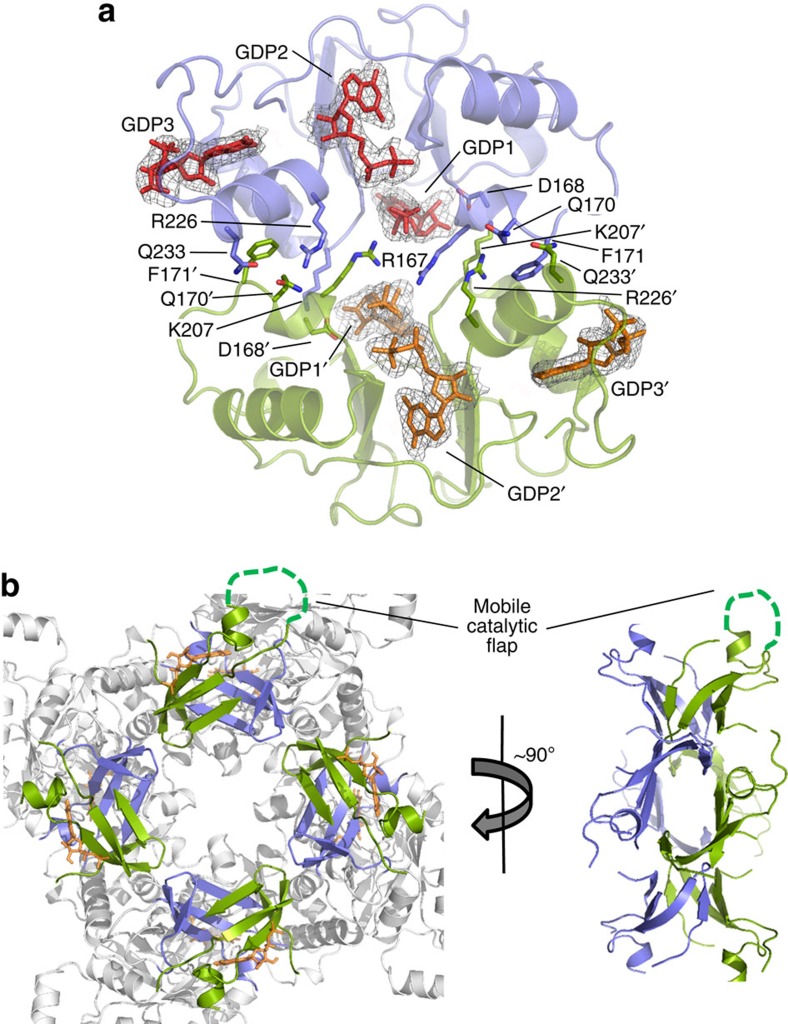
Figure 3. The bipartite interface of the AgIMPDH dimer of tetramers.
(a) Two Bateman domains from the upper and lower tetramers are shown in green and blue cartoons. GDP-binding protein residues and GDP molecules are shown in sticks. The grey meshes around GDP molecules represent the simulated annealing omit 2mFo−DFc electron density maps contoured at the 1σ level. (b) The finger domains from the upper and lower tetramers are shown in green and blue cartoons around the quaternary (left) and binary symmetry axes (right). GMP bound to the catalytic site is shown with orange sticks in the left panel. The catalytic mobile flap (not visible in our structure) is represented as a discontinuous green line in one of the monomers.

