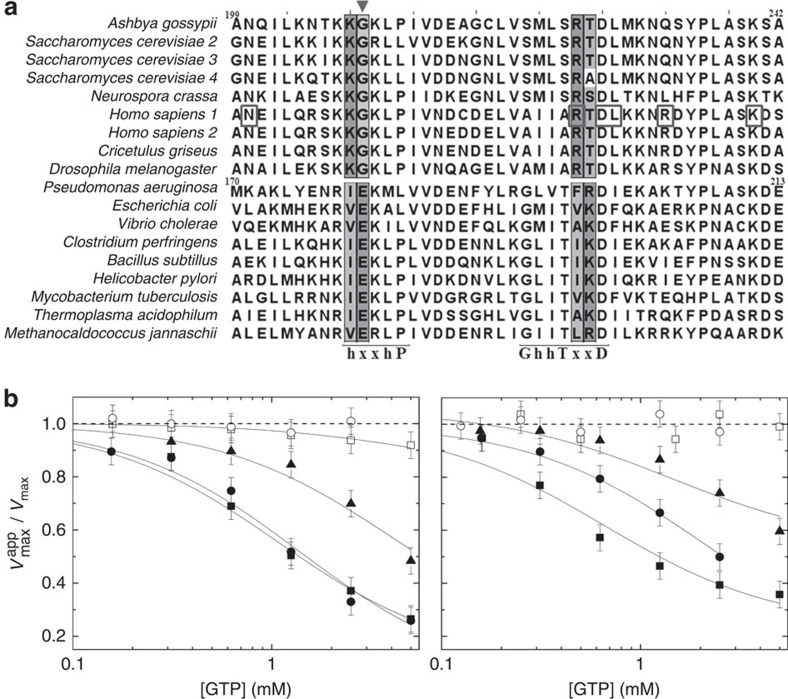
Figure 5. GTP and GDP only inhibit eukaryotic IMPDHs.
(a) Multiple-sequence alignment of the CBS2 motif within the Bateman domain of selected eukaryotic and prokaryotic organisms. The nucleotide-binding sequence motifs (‘h-x-x-h-P' and ‘G-h-hT-x-x-D')11,12 are indicated below the sequences. The highest-scoring SDPs are shown in a shaded box. The triangle indicates the glutamate residue within the ‘RIEK' motif of prokaryotic IMPDHs or the glycine within the ‘KKGK' motif that defines eukaryotic IMPDHs. Residues of the human isoform 1 associated with retinopathies are shown in a box. (b) Catalytic activity at increasing concentrations of GTP and GDP of AgIMPDH (black squares), HsIMPDH1 (black circles), HsIMPDH2 (black triangles), EcIMPDH (white circles) and BsIMPDH (white squares). The Vmax and Vmaxapp values as a function of inhibitor concentration were determined by fitting the enzyme kinetics data to the Michaelis–Menten equation. Experiments were performed in duplicate. Error bars represents s.e. The continuous lines represent the nonlinear regression fitting analysis employing a mixed inhibition model.

