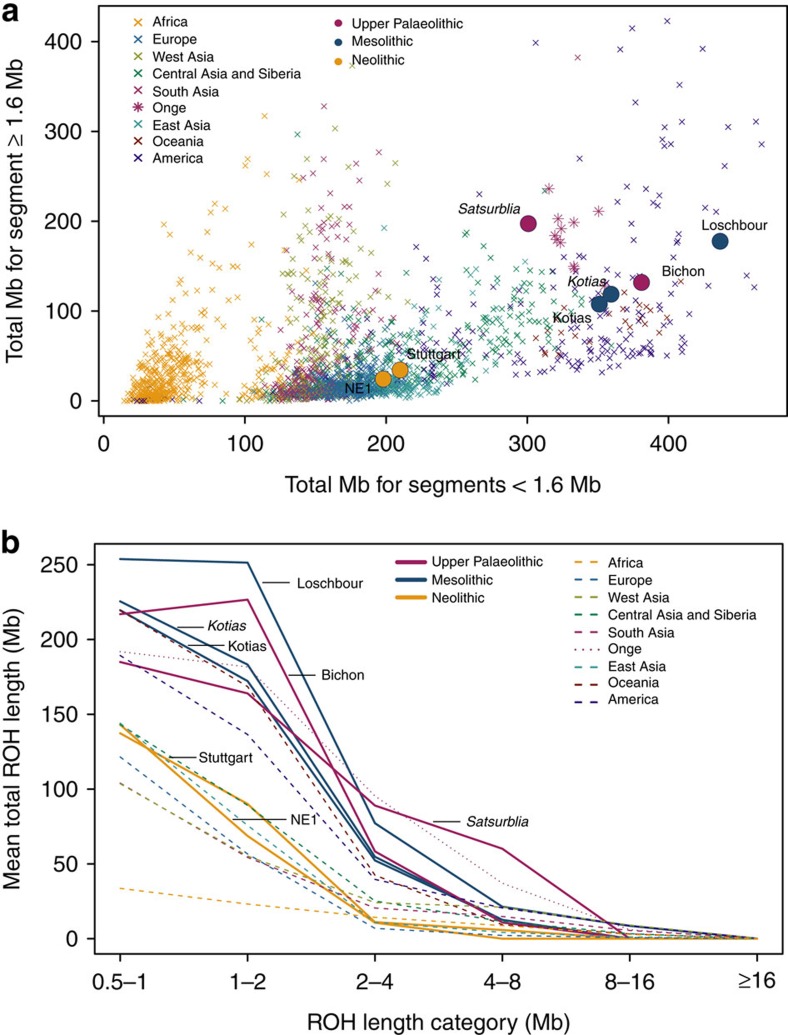
Figure 3. Distribution of ROH.
(a). The total length of short ROH (<1.6 Mb) plotted against the total length of long ROH (≥1.6 Mb) and (b) mean total ROH length for a range of length categories. ROH were calculated using a panel of 199,868 autosomal SNPs. For Kotias we analysed both high-coverage genotypes and genotypes imputed from downsampled data (marked in italics; see Supplementary Information). Diploid genotypes imputed from low-coverage variant calls were used for Satsurblia and high-coverage genotypes were used for all other samples. A clear distinction is visible between either WHG and CHG who display an excess of shorter ROH, akin to modern Oceanic and Onge populations, and EF who resemble other populations with sustained larger ancestral population sizes.

