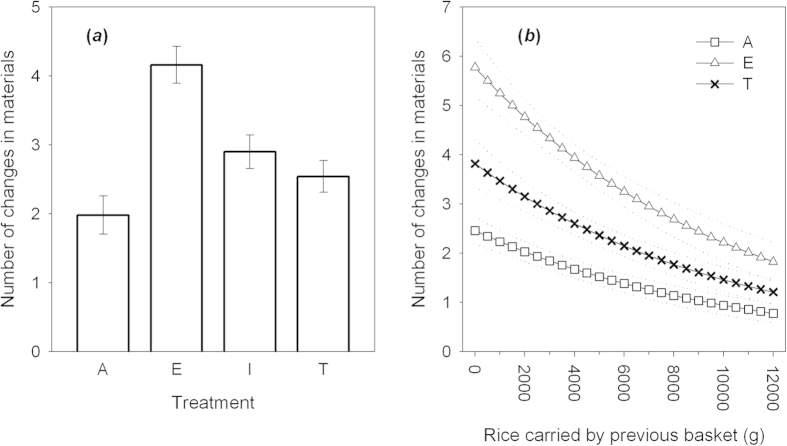
Figure 3.
(a) Mean number of changes in materials ( ± S.E.) at each step in the chain across the four treatments (b) Number of changes in materials as a function of the mass of rice carried by the previous basket in Asocial (squares) Emulation (triangles) and Teaching groups (crosses). Lines are predicted means ± S.E. from GLMM analysis.

