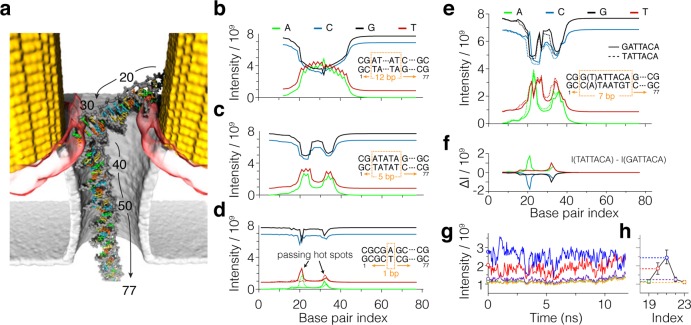
Figure 5.
SERS detection of DNA sequence. (a) Typical conformation of dsDNA trapped between two hot spots. The base pairs are numbered in ascending order from the trailing to the leading end of the molecule. (b–d) SERS signals from a poly(AT) block in the poly(CG) background. The calculated SERS intensity in the four frequency channels is shown for different locations of the poly(AT) block. The intensities are plotted in the units of peak intensities that would have been measured in each channel under the same illumination in the absence of the plasmonic enhancement. For each substitution, the DNA molecule is assumed to have the same conformation (shown in panel a). The base pair index specifies the location of the first base pair of the poly(AT) block from the trailing end of the molecule using the base pair numbering defined in panel a. Data in panels b–d correspond to poly(AT) blocks containing 12, 5, and 1 base pairs. Dashed lines in panel d indicate the signal from a TA base pair. The TA and AT base pairs differ from one another by the strands the A and T nucleotides located in the helix. (e) SERS detection of a single nucleotide substitution. The calculated SERS signals from the GATTACA and TATTACA blocks inserted at a specified location in the poly(CG) molecule. (f) Difference between the signals from the GATTACA and TATTACA blocks. (g) Effect of thermal fluctuations on SERS signal. The SERS intensity of a thymine nucleotide is plotted for a sequence of DNA conformations obtained from the all-atom MD trajectory of dsDNA trapping (at 3.7 mW laser power). The first frame of the trajectory is shown in panel a. The DNA is assumed to be made entirely from CG base pairs with the exception of a single AT base pair inserted 19, 20, 21, 22, or 23 base pairs away from the trailing end of the molecule. The color of the lines indicates the location of the thymine nucleotide in the DNA molecule (panel h). (h) Averaged over the MD trajectory SERS signals from the thymine nucleotide at the specified location in the DNA molecule. The error bars show the standard deviation of the signal.

