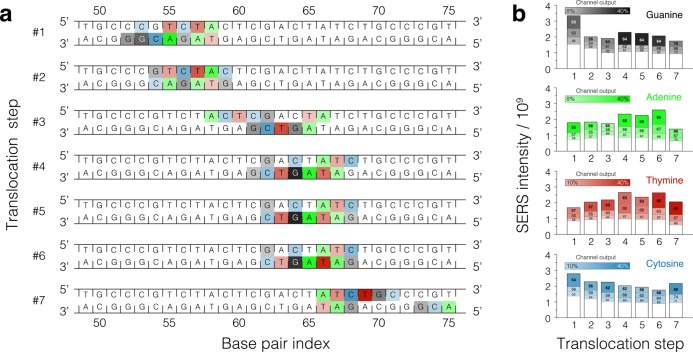
Figure 7.
SERS signal from DNA displaced in steps through a single plasmonic hot spot. (a) Schematic representation of a DNA fragment that displaced through a plasmonic hot spot in seven translocation (trapping) steps. Each nucleotide of every base pair contributes to the SERS intensity. For each translocation step, three nucleotides contributing the largest fractions of the total intensity in each frequency channel are highlighted using colors with opacities proportional to their contribution to the signal: the greater the contribution, the more intense background color; the colors are defined in panel b. Because the total intensity varies in each channel at each translocation step (panel b), coloring of the nucleotides can be discontinuous along the DNA strands. The SERS signals were computed for the all-atom MD trajectory of stepwise displacement obtained under the 5 ns on / 5 ns off plasmonic field pulse (Figure 4c); only the parts of the trajectory that had the trapping field on were used to compute the SERS signals. (b) Partitioning of the SERS signal among nucleotides of the DNA molecule. The average SERS intensity in each of the four frequency channels is plotted for each translocation step. For a given translocation step, the total height of the bar indicates the total SERS intensity; the segments of the bar indicate the contributions from individual nucleotides. The three nucleotides having the largest contributions to the total intensity in each channel are highlighted using colors and base pair indices; the white bar indicates the contribution from all other nucleotides of the same type. The height of the white bars does not vary considerably from one translocation step to the other and thus can be considered as a background offset for sequence determination purposes.

