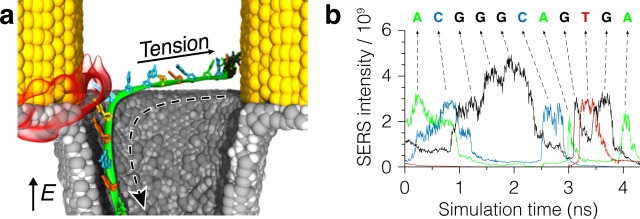
Figure 8.
SERS sequencing of single-stranded DNA. (a) All-atom MD simulation of ssDNA translocation through a single plasmonic hot spot. A single DNA strand is pulled through the nanopore by a strong transmembrane bias, while a plasmonic hot spot (red semitransparent surface) attracts the strand toward the bow tie. To prevent ssDNA from accumulating near the bow tie, an additional force is applied to the trailing end of the DNA directed away from the nanopore. (b) SERS intensity signals recorded during the translocation of ssDNA through a single plasmonic hot spot. Signals in the adenine, guanine, cytosine, and thymine SERS channels are shown in different colors. Peaks in the intensity traces correspond to the passage of individual nucleotides through the hot spot. The nucleotide sequence of the DNA fragment and its relationship to the SERS signal is shown at the top of the figure.

