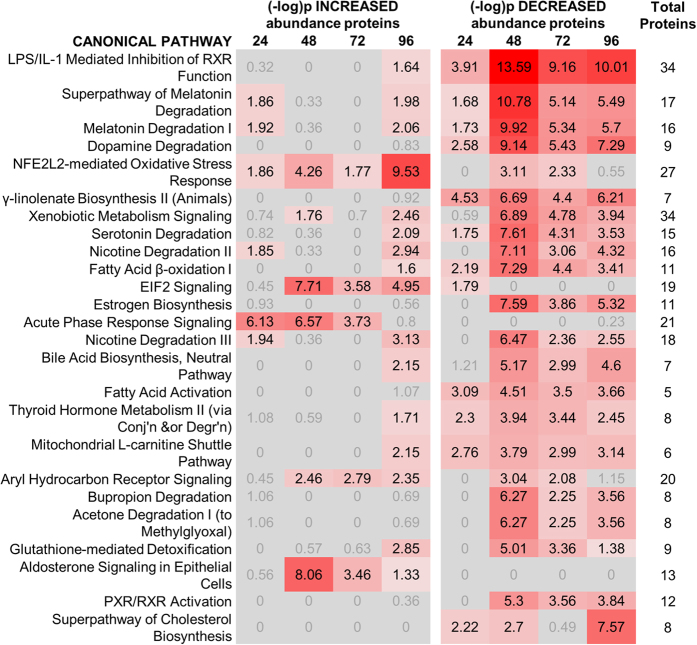
Figure 3. Analysis of the rat liver proteome reveals widespread pathway changes in response to repeat acetaminophen exposure.
Ingenuity pathway analysis showing the top twenty-five most perturbed canonical pathways during the process of adaptation to APAP exposure. The left panel shows the significance of increased abundance proteins and the right panel show significance of reduced abundance proteins. The final column denotes the number of unique proteins identified per canonical pathway. Lists are shown in Supplementary Table 3. Values in red are significant with colour intensity proportional to significance.

