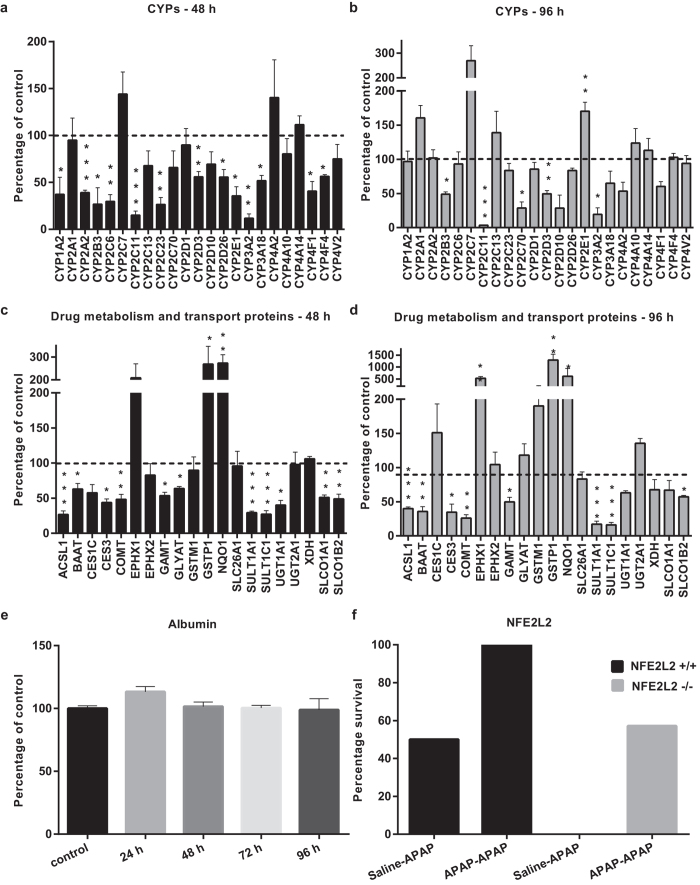
Figure 4. Investigation of key liver pathways identified by proteomic analysis in response to repeat acetaminophen exposure.
In rats, while the abundance of phase I (CYP450) proteins at (a) 48 h and (b) 96 h, and phase II and III proteins at (c) 48 h and (d) 96 h was altered compared to control, serum albumin (e) remained statistically unchanged throughout the timecourse. Bars represent mean protein abundance (n = 3–4; percentage of control +SEM). Dashed lines indicate mean control value. Statistical analysis was performed using a linear model in the R programming environment (ANOVA with Dunnett’s post-test, *p < 0.05, **p < 0.01, ***p < 0.001). (f) Survival of NFE2L2+/+ and NFE2L2−/− mice in APAP adaptation study. Bar chart comparing survival of toxic challenge after APAP or saline (0.9%) pretreatment in NFE2L2+/+ or NFE2L2−/− animals. Mice were pretreated with incremental doses of APAP ranging from 150–600 mg/kg i.p. or vehicle control for 8 days followed by a final challenge of 1000 mg/kg APAP or vehicle on day 9.

