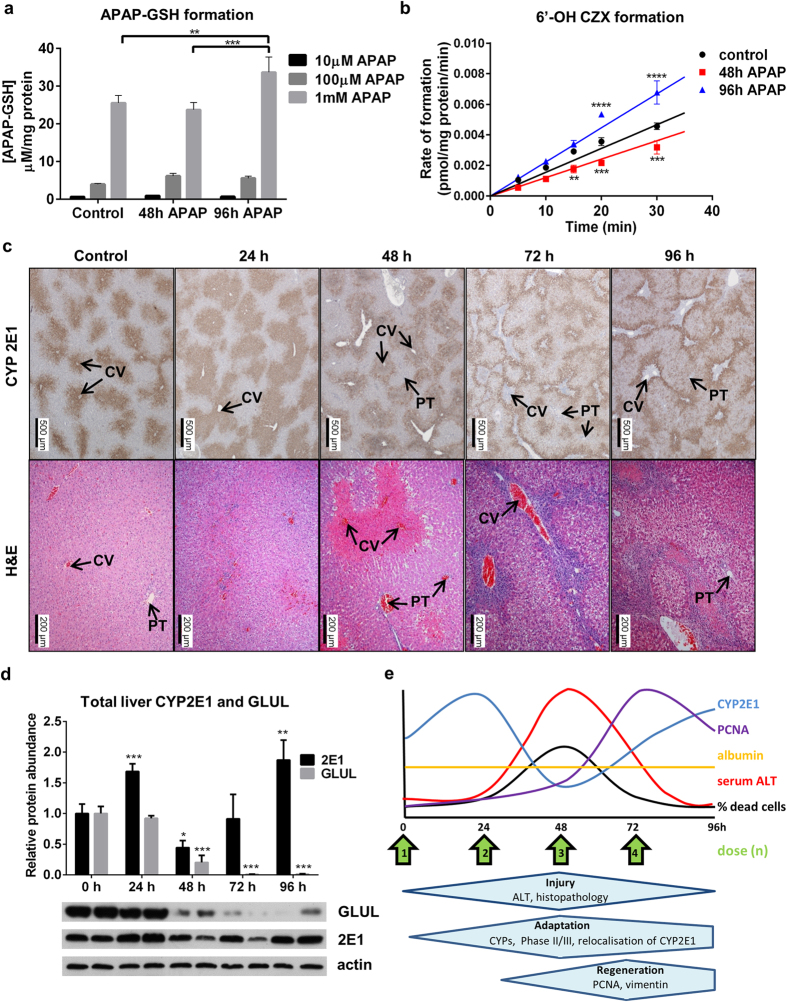
Figure 5. Rat liver CYP2E1 activity and localisation changes in response to repeat acetaminophen exposure.
Microsomal formation of (a) APAP-GSH and (b) 6′-OH chlorzoxazone in animals which were either vehicle control treated, or repeat dosed with or without toxicity. Microsomal CYP2E1 activity is reduced in toxic (48 h treated, red squares) group and increased in non-toxic (96h treated, blue triangles) group compared to control (black circles). APAP metabolism is significantly higher in non-toxic (96h treated) group (**p < 0.01, ***p < 0.001, ****p < 0.0001). Best fit curves for each group (solid lines) were modelled using literature values for Km and Vmax. (c) Top panel shows representative IHC staining for CYP2E1 across the timecourse; bottom panel shows H&E stain. CV indicates central vein, while PT indicates the portal triad. CYP2E1 redistributes markedly as the timecourse progresses. (d) Densitometric analysis of total liver GLUL, CYP2E1 and actin detected by western blot, showing preferential restitution of CYP2E1 abundance over the similarly centrilobular glutamine synthetase (*p < 0.05, **p < 0.01, ***p < 0.001). (e) Graphical summary of the model.

