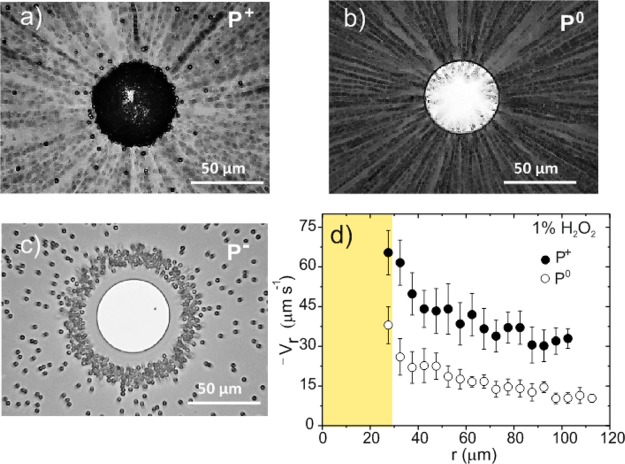
Figure 2.
Motion of (a) positive, (b) quasi-neutral, and (c) negative particles using a p-doped Si/Pt pump in 1% H2O2. Positive particles stick on the Pt disk. The black color of the disk is due to the accumulation of particles. The quasi-neutral P0 particles move toward the platinum disk. After having crossed the Si–Pt border, they are pushed upward. The figures are the superposition of 45 images recorded with the optical microscope every 0.2 s. (d) Average radial velocity (Vr) of P+ and P0 particles as a function of the radial component in H2O2. The yellow area represents the area of the platinum disk. The diameter of the disk is 50 μm. The velocity plot for P+ particles is based on the averaged data of eight devices and 28 particles. The plot for P0 tracers has been obtained by processing three devices and 19 particles.

