
Figure 1. Rarefaction curves of OTUs diversity for each sample.
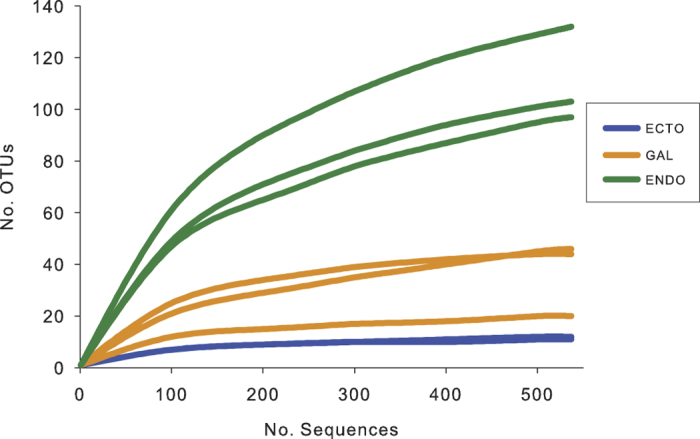
Each of the samples contains 537 sequences to obtain equal sampling depth. “Ecto”, ectomicrobiome; “Gal”, microbiome of the galleries; “Endo”, endomicrobiome.
Official websites use .gov
A
.gov website belongs to an official
government organization in the United States.
Secure .gov websites use HTTPS
A lock (
) or https:// means you've safely
connected to the .gov website. Share sensitive
information only on official, secure websites.
Each of the samples contains 537 sequences to obtain equal sampling depth. “Ecto”, ectomicrobiome; “Gal”, microbiome of the galleries; “Endo”, endomicrobiome.