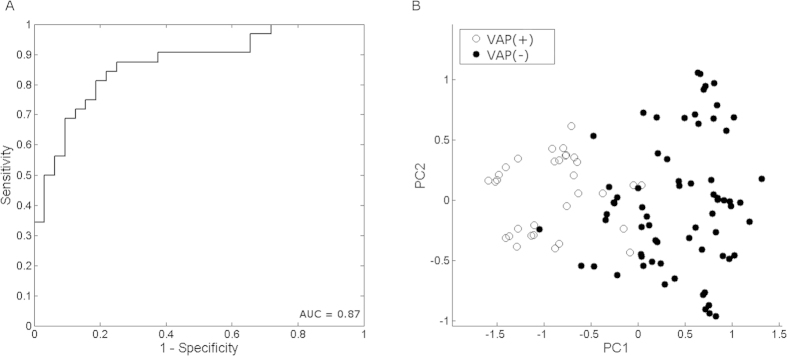
Figure 1. ROC and PCA plots visualizing the separation of the VAP(+) and VAP(−) groups.
(A) Receiver operating characteristic (ROC) curve of VAP(+) vs. VAP(−). It consists of 1-sensitivity on the x-axis and specificity on the y-axis. (B) The PCA plot is based on the proximities between samples of VAP(+) (white) and VAP(−) (black).

