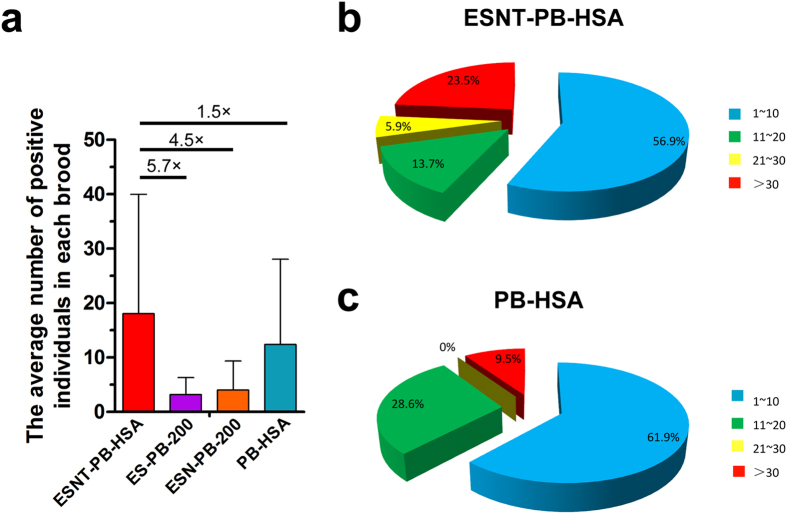
Figure 4. Quantification of transgenic individuals in each brood.
(a) The average number of positive silkworms in the ESNT-PB-HSA series transgenic strain was 5.7, 4.5 and 1.5 times higher than in ES-PB-200, ESN-PB-200 and PB-HSA, respectively. (b,c) Total positive broods are divided into four groups to more clearly present the distribution of the number of transgenic individuals in each brood. The pie charts show that the proportions of broods with 21–30 and > 30 transgenic individuals were dramatically improved in the ESNT-PB-HSA series transgenic silkworms compared with PB-HSA.

