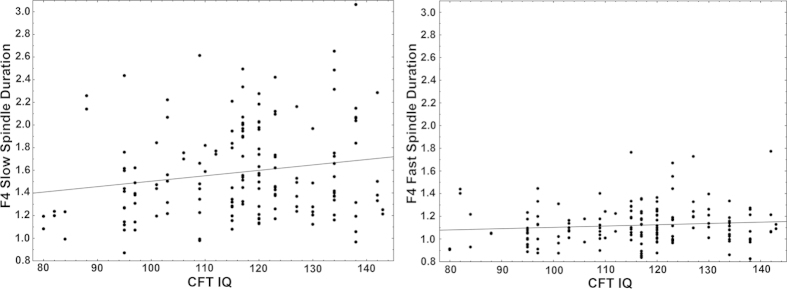
Figure 1. Scatterplots illustrating the correlation between slow (left panel) and fast (right panel) spindle duration (axis y) and CFT IQ score (axis x) on the electrode F4 where the effect was found to be the strongest.
While the correlation is only significant in case of slow spindle duration, the two correlation coefficients are not statistically different from each other (Fisher’s z = 3.12, p > 0.1).

