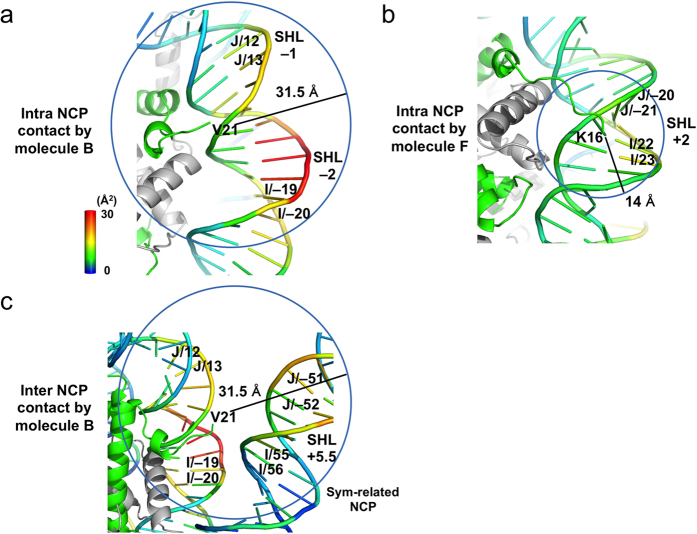
Figure 4. Representation of B-factor-increased nucleosomal DNA regions by the H4 tetra-acetylation.
(a) Intra-nucleosomal contacts by the molecule-B H4. The DNA chains are color-coded by the difference in the B-factors between the H4-tetra-acetylated and unmodified NCPs. The color bar represents the B-factor difference from 0 Å2 (blue) to 30 Å2 (red). (b) Intra-nucleosomal contacts by the molecule-F H4. (c) Inter-nucleosomal contacts by the molecule-B H4.

