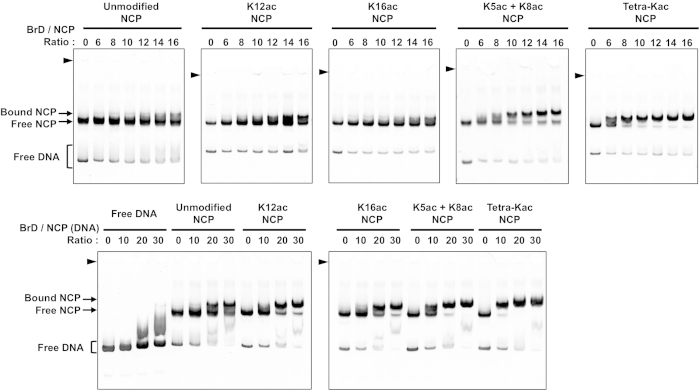
Figure 6. Electrophoresis mobility shift assay of the binding between H4-acetylated NCPs and the TAF1 double bromodomain (TAF1-BrD).
The indicated ratios of the TAF1-BrD were mixed with the respective NCPs. The bands corresponding to the TAF1-BrD-bound NCP, the TAF1-BrD-unbound NCP, and the free DNA are respectively indicated by the arrows and brackets on the left. The positions of the wells are indicated by arrowheads.

