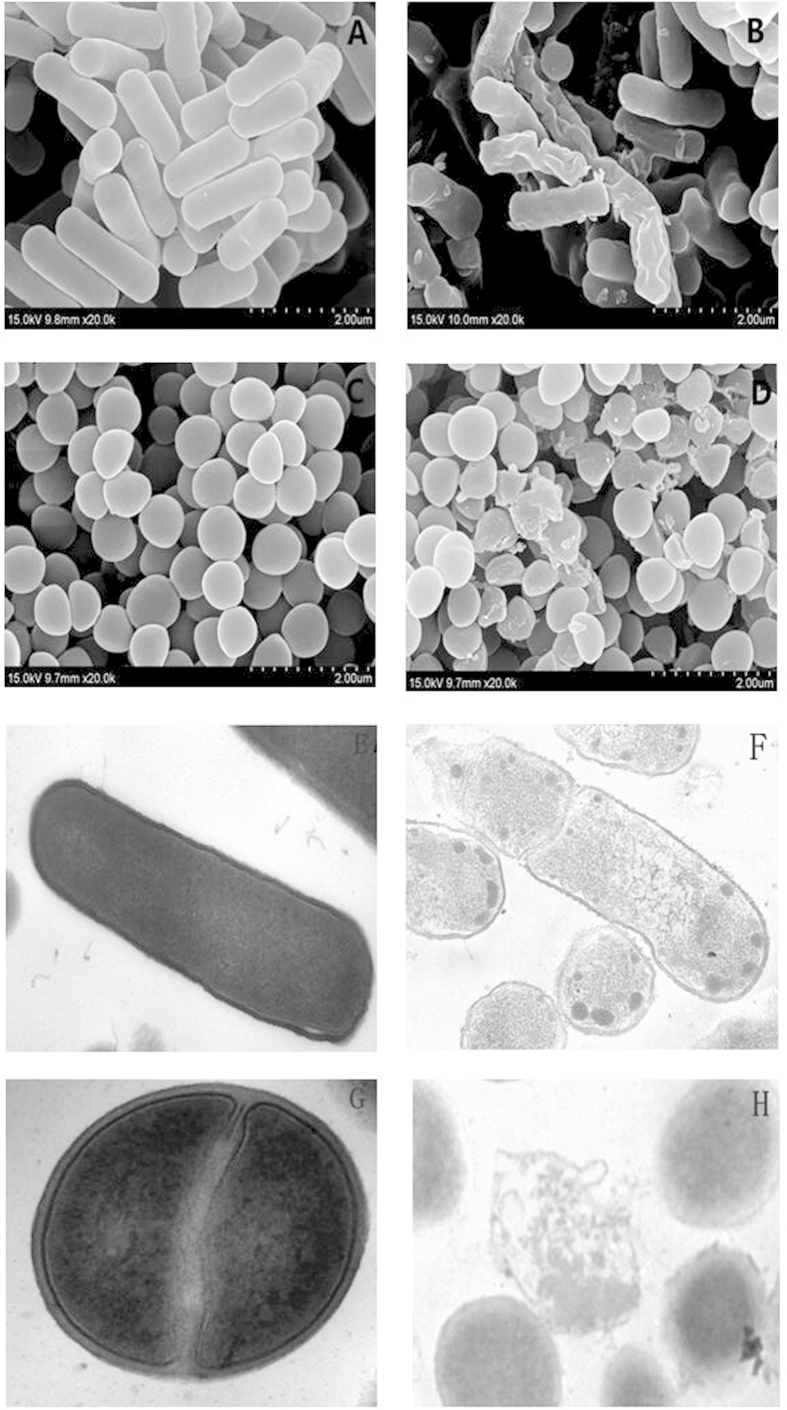
Figure 7. Scanning and transmission electron micrographs of E. coli 25922 and S. aureus 29213 treated with the peptide dCATH.
SEM micrographs of E. coli: (A) Control, no peptide; (B) peptide-treated. SEM micrographs of S. aureus: (C) Control, no peptide; (D) peptide-treated. TEM micrographs of E. coli: (E) Control, no peptide; (F) dCATH-treated; TEM micrographs of S. aureus: (G) Control, no peptide; (H) dCATH-treated. Bacteria in mid-logarithmic phase were treated with the peptide at 1× MIC for 1 h.

