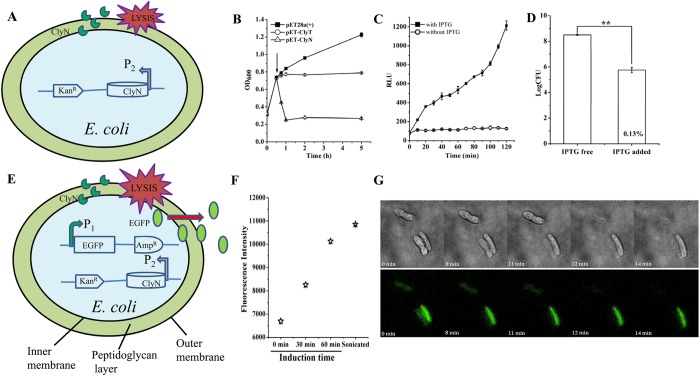
Figure 1. Induced lysis of host E. coli cells.
(A) Schematic of the induced lysis of E. coli cells. (B) Effect of lytic proteins on the growth of host E. coli cells. BL21(DE3)/pET28a(+), BL21(DE3)/pET-clyT, and BL21(DE3)/pET-clyN cells were cultured in LB to OD600 = 0.8, then induced with 0.5 mM IPTG (arrow shown in the graph) and the changes of OD600 were monitored. (C) Release of ATP efflux from BL21(DE3)/pET-clyN cells after induction determined by a luciferin-luciferase system measuring relative light units (RLUs). Cells without IPTG induction were used as controls. (D) The lytic efficacy of ClyN induced lysis on host E. coli cells was confirmed by plating onto LB agar plates. (E) Schematic for the induced releasing of a recombinant protein (i.e. EGFP) inside E. coli cells. (F) Time-release kinetics of EGFP from ClyN induced lysis in host E. coli cells compared to sonicated cells. (G) Time-lapse microscopy analysis of ClyN induced host cell lysis. BL21(DE3)/pET-clyN/pBAD-egfp cells were induced with 0.2% L-arabinose, transferred to agar plates with 1 mM IPTG, then observed on a DeltaVision OMX V4 imaging system.

