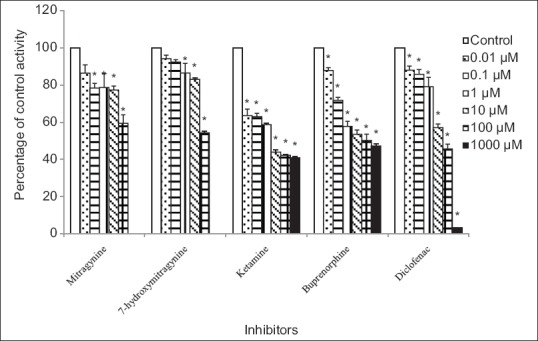
Figure 2.

Inhibitory effects of mitragynine, 7-hydroxymitragynine, ketamine, buprenorphine, and diclofenac on 4-methylumbelliferone glucuronide formation by rat liver microsomes. Panels to the right show inhibitor concentrations. Each bar represents the mean percentage activity relative to control ± standard error of mean for three independent measurements (n = 3). Statistical analysis was conducted using one-way ANOVA and Dunnett test. *P < 0.05 versus control (no inhibitor)
