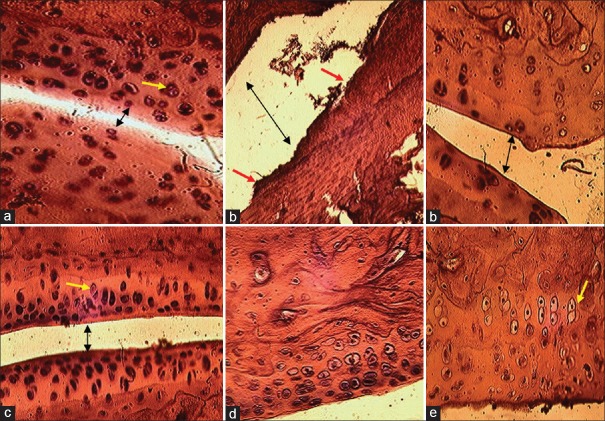
Figure 10.
Histological structures of joint and cartilage (H and E, ×400) from treated and nontreated rats. The normal control rat (a); the arthritic rat (b); methanol extract of Vitellaria paradoxa treated rat 150 mg/kg (c), 300 mg/kg (d) and diclofenac-treated rat (e). The black arrow (in a-c) showed the joint space variation, the yellow arrow showed the chondrocytes in the cartilage tissue and red arrow showed cartilage erosion

