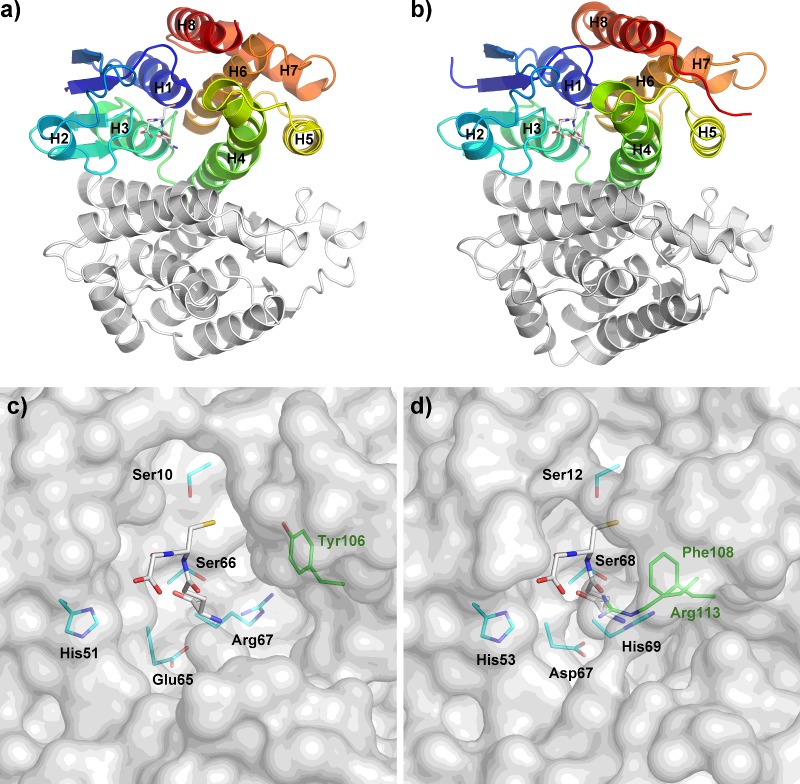
Figure 4. Active site pockets of DmGSTE6 in comparison with dmGSTD1.
Arrangement of helices in dmGSTD1 (a and c) and DmGSTE6 (b and d) contributes to the shape of active site pockets. Stick representation of glutathione is in white and its interacting residues from the N-terminal and the C-terminal domain are in cyan and green, respectively. Tyr106 in panel c is for comparison only.

