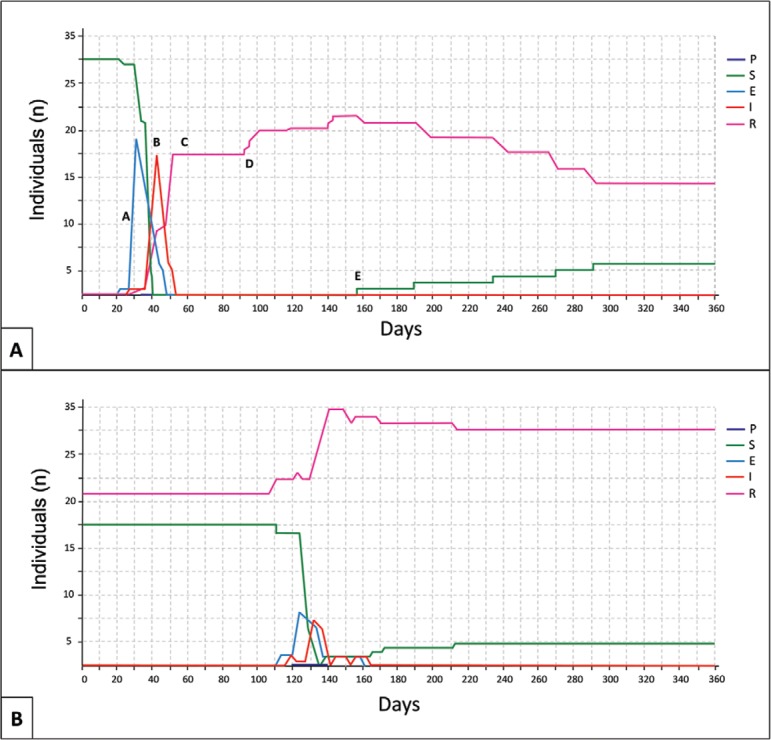
Fig. 2A: trajectory of disease dynamics in year 1 of a single iteration of the baseline brown howler monkey simulation model using Outbreak alone. Specific points in the trajectory are designated by letters A-E and are described in more detail in the main text; B: trajectory of disease dynamics in year 50 of a single iteration of a brown howler monkey simulation model using Outbreak alone. Note the relatively high proportion of resistant individuals at the start of the outbreak on day 115, leading to a yellow fever outbreak of lower overall intensity. E: exposed; I: infectious; P: pre-susceptible; R: recovered/resistant; S: susceptible.

