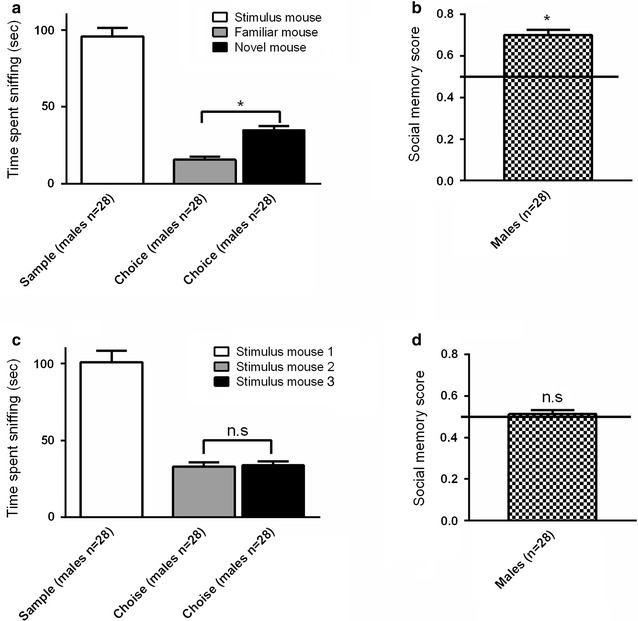
Fig. 1.

Validation of the social discrimination model measuring social recognition. Male focal mice discriminated between novel and familiar a, b or only novel GDX female stimulus mice c, d. a, c White bars represent the amount of time spent sniffing a novel conspecific contained in a wire corral during the 10 min sampling session. Grey and black bars represent the amount of time spent sniffing different stimulus mice during the 5 min choice session. b, d Chequered bars represent social memory scores. Error bars represent mean ± SEM, *p < 0.05
