Fig. 1.

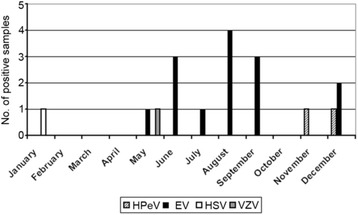
Monthly distribution of positive samples. Shown is the cumulative number of positives samples in each month from January to December. Each viral pathogen detected (HPeV, EV, HSV, VZV) is indicated by a different bar

Monthly distribution of positive samples. Shown is the cumulative number of positives samples in each month from January to December. Each viral pathogen detected (HPeV, EV, HSV, VZV) is indicated by a different bar