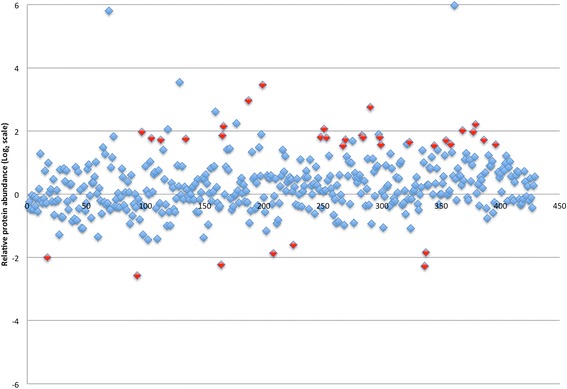
Fig. 4.

Logarithm (base 2) plot of relative abundances of all proteins identified in cholesteatoma-involved ossicles in reference to control ossicles. Positive values indicate greater protein content in cholesteatoma-involved bone. The 34 proteins exceeding threshold abundances and meeting inclusion criteria are highlighted in red
