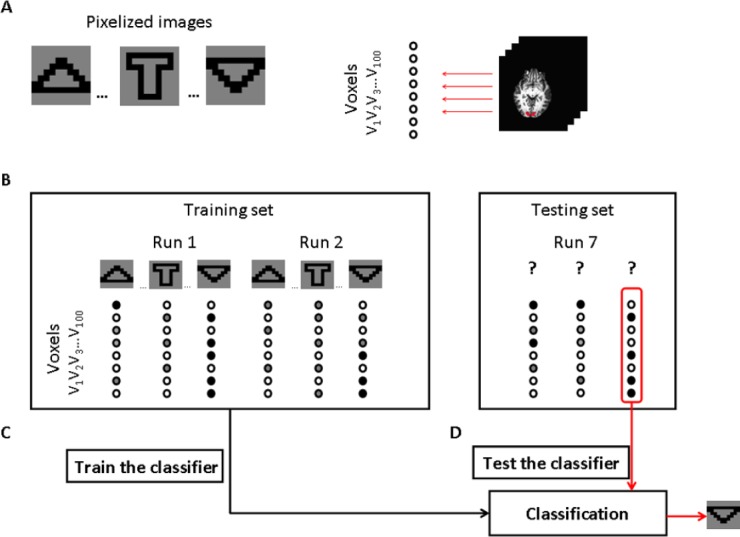
Figure 3.

Illustration of how the functional magnetic resonance imaging (fMRI) data could be analyzed using multi-voxel pattern analysis (MVPA) in this study.
(A) Brain responses were recorded while participants viewed pixelized images. The 100 selected voxels in the region of interest were included in the classification analysis. (B) The fMRI time series were decomposed into discrete brain activation patterns that correspond to the pattern of activity across the selected voxels at a particular point in time. Each brain activation pattern was labeled according to the corresponding pixelized image. The brain activation patterns were divided into a training set and a testing set. (C) Brain activation patterns from the training set were used to train a classifier function that could map between brain activation patterns and pixelized images. (D) The trained classifier was used to predict the pixelized image from the test set.
