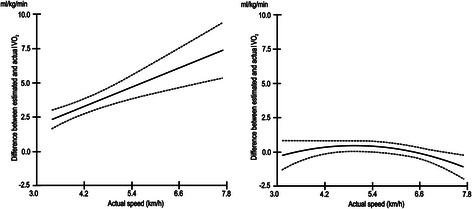
Fig. 2.

Prediction error of VO2 on the free-living walks for the treadmill- and track-based calibration methods. Figure 2 shows the relationship between mean prediction error for VO2 (ml · kg−1 · min−1) and actual walking speed (km · h−1) on the free-living walks for the treadmill- (left) and track-based (right) calibration methods. Dashed lines are 95 % confidence intervals
