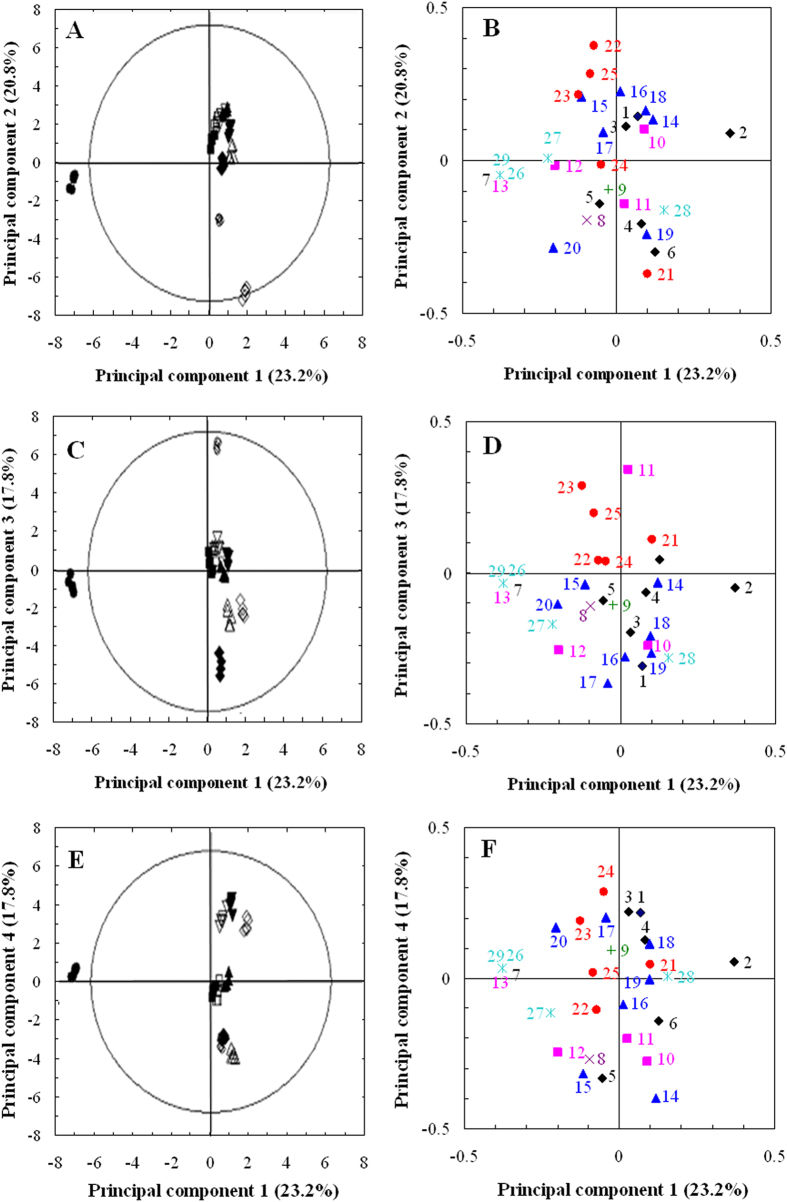
Figure 2. PCA of VOCs of T. melanosporum fermentation samples.
Five fermentation time-points were selected and treated with the RFTT. Score and loading plots for the first, second, third and fourth principal components are shown. PC1 (23.2%) was plotted against PC 2 (20.8%) (A, B), against PC3 (17.8%) (C, D), and against PC4 (13.7%) (E, F) to produce the PC score plots and loading plots. Symbols for different treatment fermentation samples: Day 2-control (closed circle, ●), Day 2-RFTT (open circle, ○), Day 3-control (closed square, ■), Day 3-RFTT (open square, □), Day 4-control (closed triangle, ▲), Day 4-RFTT (open triangle, △), Day 5-control (closed diamond, ♦), Day 5-RFTT (open diamond, ⋄), Day 7-control (closed inverted triangle, ▼), Day 7-RFTT (open inverted triangle,▽).

