Fig. 2.

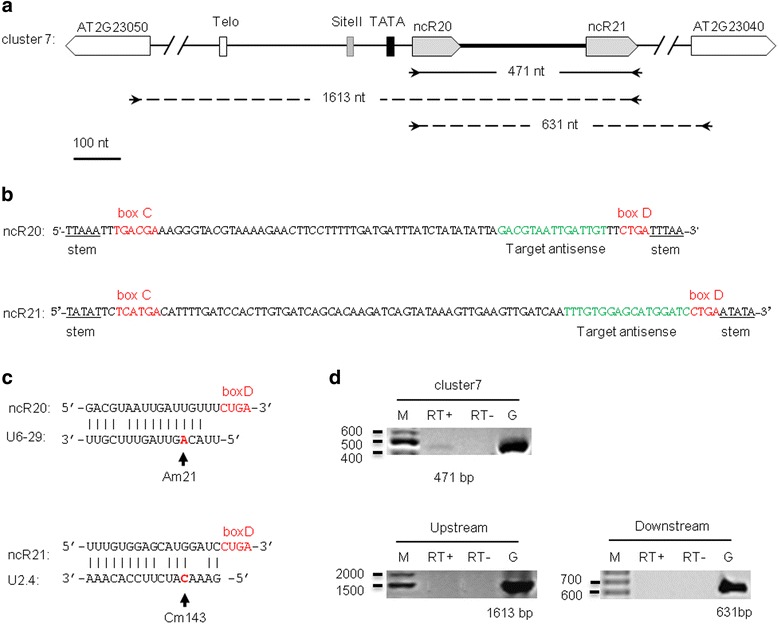
Identification of the clustered scaRNAs ncR20 and ncR21. (a) Schematic representation of scaRNA cluster 7. The scaRNAs are denoted by gray pentagons. The TeloSII and the TATA elements are represented by boxes: Telo (open box), Site II (gray box), and TATA (black box). The primers designed for cluster 7 and the expected amplicon sizes are indicated by arrows and a solid line. Additional primers corresponding to the adjacent genes designed for evaluation of independency of transcription of cluster 7 are shown as dashed lines. (b) The sequence features of ncR20 and ncR21: motifs C/D and the target antisense region are indicated in red and green colors, respectively; double-stranded-forming regions at the termini are underlined. (c) Predicted targets of ncR20 and ncR21. The positions of predicted methylated residues are indicated bold letters and red color. (d) RT-PCR analysis of cluster 7 precursor expression in 2-week-old seedlings. RT+ and RT- indicate the presence or absence of reverse transcriptase in the reaction, respectively. Molecular markers are shown in lane labeled with M. Genomic DNA (lane labeled with G) was used as positive control. The expected RT-PCR product sizes are provided below the lanes with product amplified on genomic DNA. The absence of amplification signals in “Upstream” and “Downstream” panels indicates the independent from neighboring genes character of cluster 7 transcription
