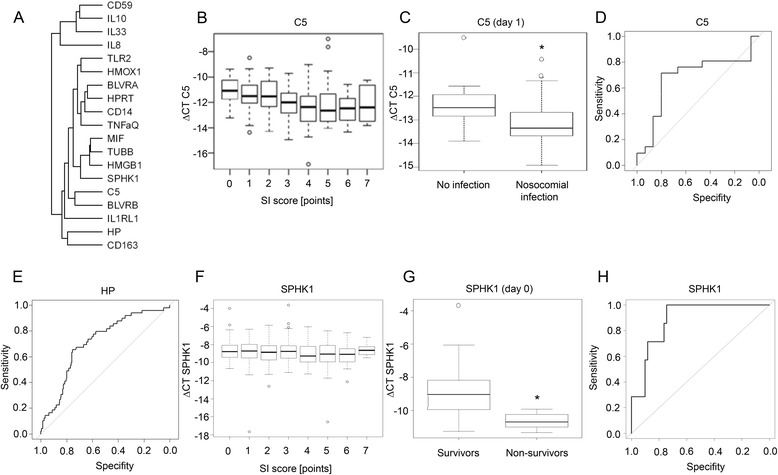
Fig. 4.

Characterization of selected transcriptomic markers with best performance. a Dendrogram depicting unsupervised cluster analysis of all transcriptomic markers: HP, CD163, HMOX1, BLVRA, BLVRB, IL-10, TLR2, CD14, IL-8, HMGB1, IL-33, IL-1RL1, C5, CD59, TNFα, MIF, SPHK1, HPRT, TUBB, and ACTB. b Correlation of C5 expression (∆CT) with the systemic inflammation (SI) score (n ≥ 53 patients). c Expression of C5 in leukocytes on day 1 after trauma from patients who developed nosocomial infections during the further course in comparison with patients without infection. ROC curves for d C5 (endpoint: nosocomial infection; AUC = 0.68) and e HP (endpoint: sepsis; AUC = 0.71). f Correlation of SPHK1 expression (∆CT) with the SI score (n = 71 patients). g Comparison of SPHK1 expression (∆CT) in survivors and nonsurvivors. h ROC curve for SPHK1 on day 0 (endpoint: mortality; AUC = 0.89). *p <0.05. HP haptoglobin, SPHK sphingosine kinase
