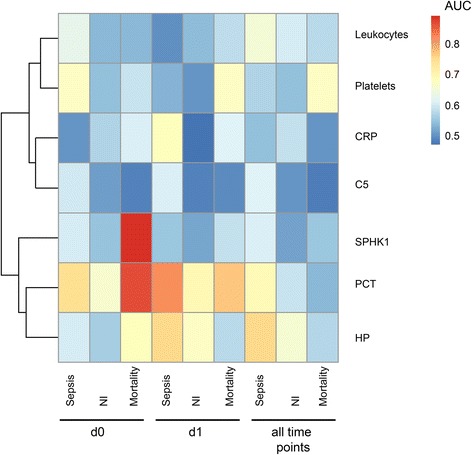
Fig. 5.

Comparison of the performance (heatmap of AUC values) of selected clinical and transcriptomic parameters regarding specific outcomes (sepsis, nosocomial infections (NI), mortality) and time points of assessment (day 0 (d0), day 1 (d1), all days); n = 71 patients. AUC area under the curve, CRP C-reactive protein, HP haptoglobin, PCT procalcitonin, SPHK sphingosine kinase
