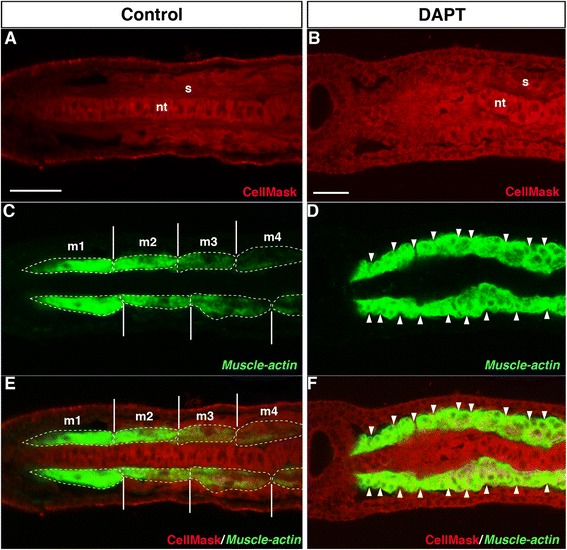
Fig. 4.

Effect of DAPT treatment on BfMuscle-actin expression. a, c, e DMSO-treated control embryo (n = 5, 100 %). Anterior to the left. Dorsal view. nt, notochord; s, somite; m, myotome. CellMask (Red) labelled the plasma membrane. BfMuscle-actin (Green) was stained by fluorescence in situ hybridization. The white dotted circle indicates a myotome. The white line indicates the segmental border between myotomes. b, d, f DAPT-treated embryo (n = 5, 100 %). Anterior to the left. Dorsal view. The white arrowhead indicates a possible segmental border between myotomes. Scale bars, 20 μm
