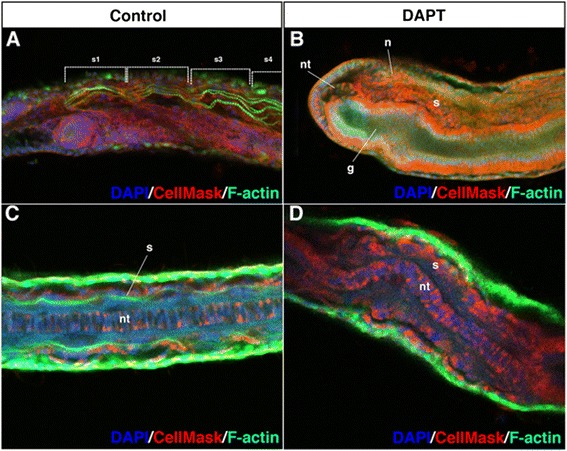
Fig. 5.

Filament formation of actin is suppressed by DAPT treatment. a DMSO-treated control embryos display filamentous actin in the rostral somites (n = 12, 100 %). b F-actin staining in the somites. Treatment with 100 μM DAPT from the late gastrula stage onwards (n = 10, 100 %). The images were taken using an LSM 710 confocal microscope (Zeiss). c Dorsal view of DMSO-treated control embryos. d Dorsal view of DAPT-treated embryos. s somite, nt notochord, n neural tube, g, gut. Nuclei were labelled in blue and the plasma membrane was labelled in red
