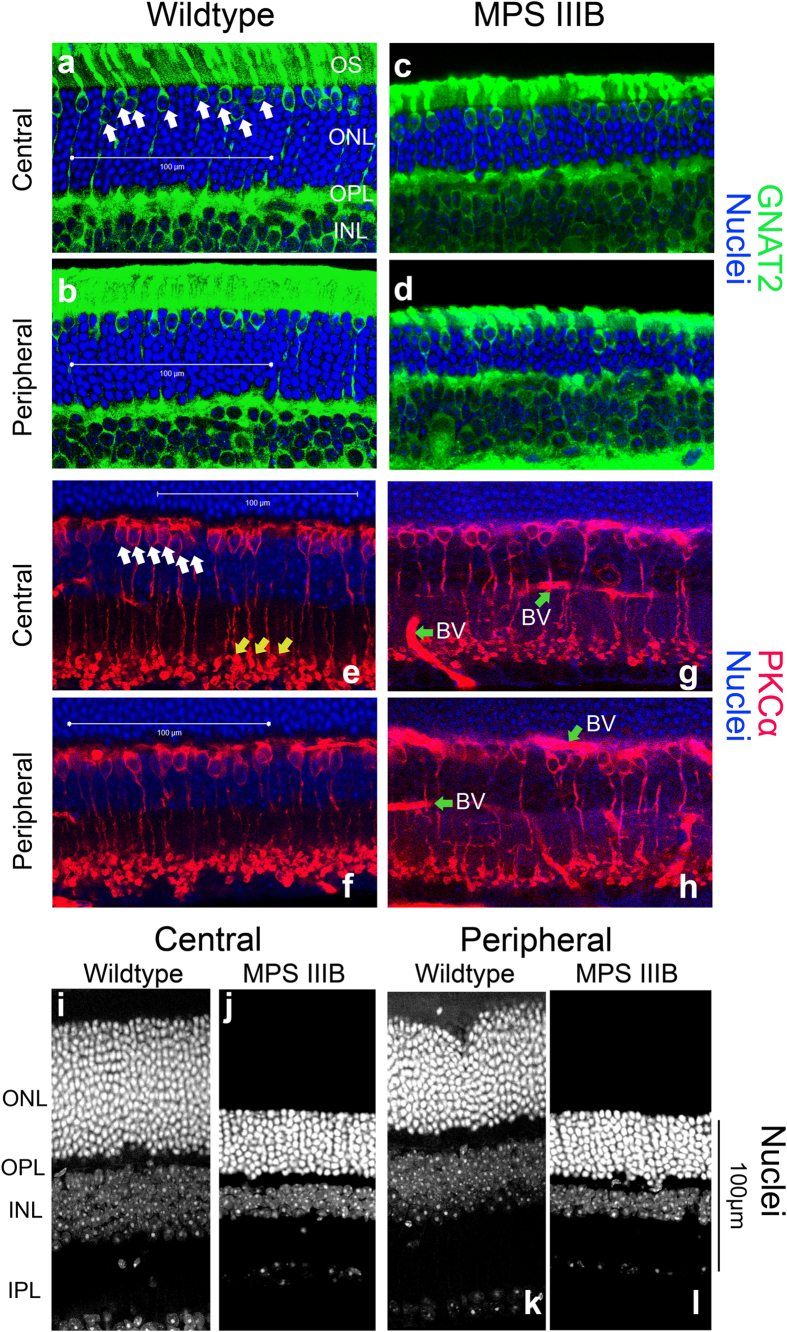
Figure 5. Representative confocal micrographs of retina sections taken from central and peripheral regions of WT (A,B,E,F) and MPSIIIB (C,D,G,H) mice at the 46th week processed for TO-PRO3 (blue) and GNAT2 (cones; green), or TO-PRO3 (blue) and PKCα (rod bipolar cells; red).
White scale bar: 100 μm. (a–d) TO-PRO3 labelled all photoreceptor somas in the outer nuclear layer (ONL) without differentiating rods and cones. The MPS IIIB samples have prominently reduced ONL thickness compared to the WT retina in both central and peripheral regions. Somas co-labeled by GNAT2 antibody and TO-PRO3 in (a–d) were cone somas (Some of those cells are identified by arrows in panel (a) as examples). There was no obvious change in the number of cone somas in the MPS IIIB retina. The green channel was enhanced to help visualizing the cones, leading to some non-specific reactivity in the inner nuclear layer (INL). (e–h) Rod bipolar cells were immuno-reactive to antibody for PKCα. In panel E, white arrows indicate the soma and yellow arrows indicate axonal terminals of rod bipolar cells as examples. Compared to samples from WT mice, MPSIIIB samples showed a general loss of rod bipolar cells in both regions. Green arrows denote non-specific labeling of blood vessels (BV) in G and H. Representative confocal micrographs comparing showing only nuclear staining (TO-PRO3) of WT and MPSIIIB mice at the 46th week (i–l).

