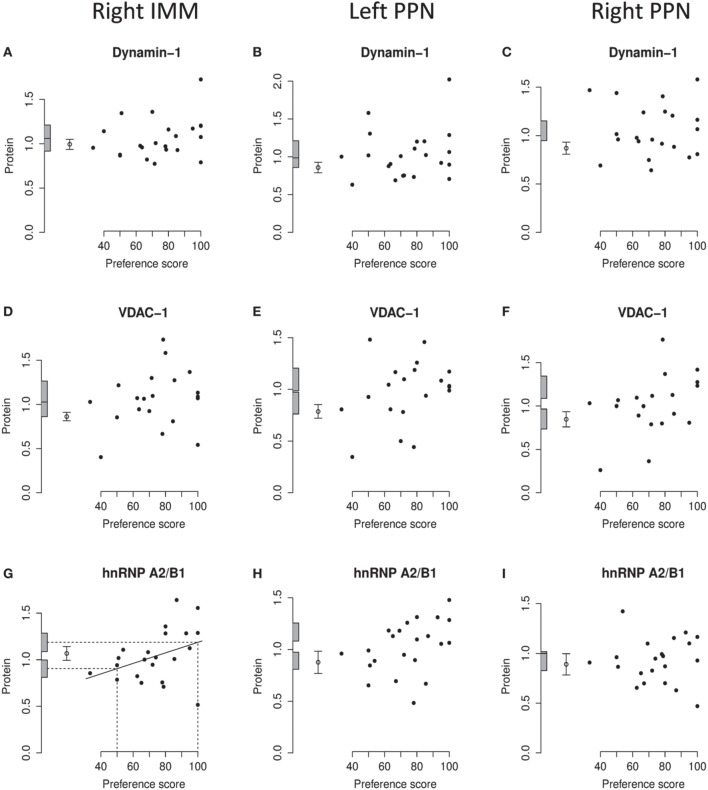
Figure 6.
Right IMM and right and left PPN, standardized relative amount of dynamin-1, VDAC-1, and hnRNP A2/B1, plotted against preference score. (A–C), dynamin-1; (D–F), VDAC-1; (G–I), hnRNP A2/B1. Left-hand column right IMM, middle and right-hand columns left and right PPN, respectively. Conventions otherwise as for Figure 4.

