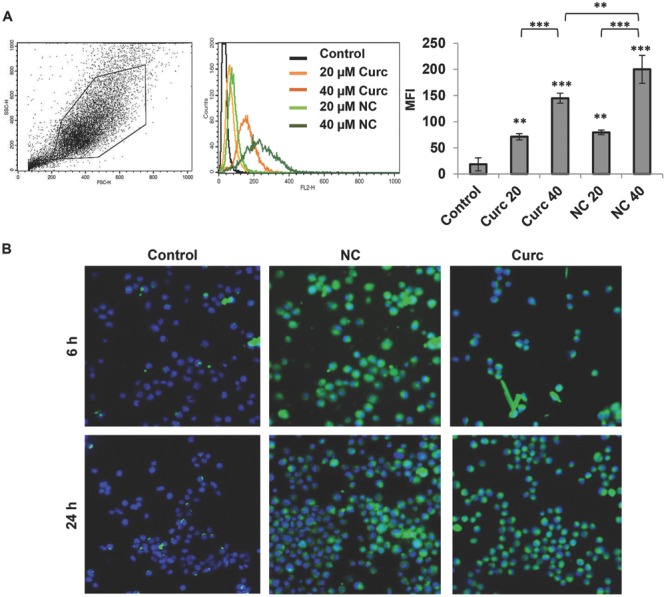
Figure 3.

Intracellular uptake of NC in CT26 murine colon cancer cells in vitro. A) CT26 cells were incubated with either the free drug or the NC formulation for 6 h. Cellular uptake was assessed by measuring the mean fluorescence intensity (MFI) using flow cytometry and FL-2 detector. Drug uptake was enhanced, in a dose-dependent uptake pattern, when encapsulated in the NC. B) Cellular uptake was assessed by confocal laser scanning microscopy after 6 and 24 h. Curcumin uptake was indicated by green fluorescence inside the cells and nuclei were counterstained with DAPI. Values are expressed as mean ± SD (n = 3). *P < 0.05, **P < 0.01, ***P < 0.001 (one-way ANOVA test). Asterisks correspond to statistically significant differences between a particular group and control, unless indicated otherwise.
