Figure 4.

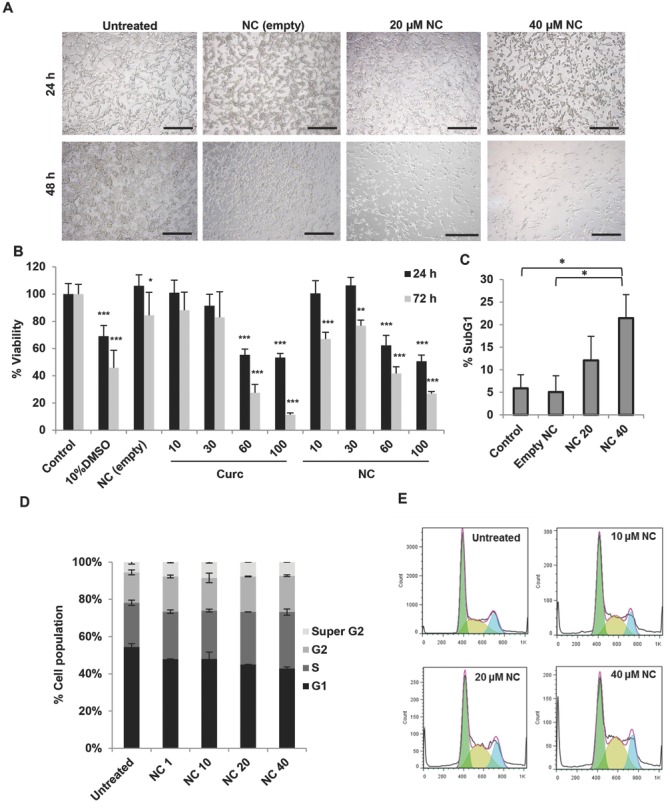
Cytotoxicity of NC in CT26 murine colon cancer cells in vitro and cell cycle distribution analysis. CT26 cells were incubated with NC for 24–72 h at increasing drug concentrations (from 10 × 10−6 to 100 × 10−6 m). A) Microscopic examination of CT26 cells after treatment with NC for 24 or 48 h. Cell rounding and reduction in cell number was observed for cells treated with drug-loaded NC in a time- and dose-dependent manner (scale bar 150 μm). B) Cell viability expressed as a percentage of control untreated cells, determined by MTT assay, was reduced as a function of drug concentration at both 24 and 72 h (n = 5). C) Percentage SubG1 cell population (apoptotic cells), determined using PI staining method, significantly increased, compared to untreated cells, when treated with 40 × 10−6 m for 48 h (n = 3). D) Relative changes in the percentage of cell cycle phases following 48 h of NC treatments. A shift in cell cycle distribution from G1 to S phase occurred in a dose-dependent manner (n = 3). Representative histograms showing the cell cycle distribution are shown in E). Values are expressed as mean ± SD. *P < 0.05, **P < 0.01, ***P < 0.001 versus control (one-way ANOVA test).
