Figure 5.

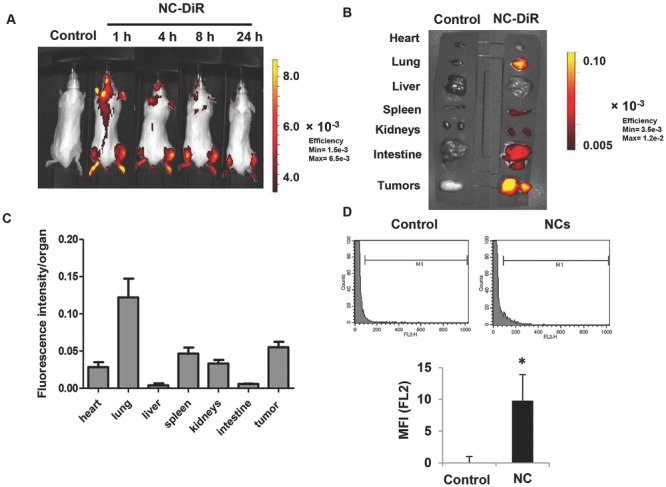
In vivo and ex vivo organ biodistribution of DiR-labeled NC in CT26 tumor bearing Balb/c mice after systemic administration. Mice were i.v. injected with PBS, NC-DiR or unlabeled NC. Dose injected was equivalent to 312.5 mg polymer per kg or 18.75 mg DiR per kg. A) Representative whole body in vivo images obtained at 1, 4, 8, and 24 h post-injection. B) Representative ex vivo images of excised organs at 24 h post-injection. C) Ex vivo quantification of fluorescence signals of DiR-labeled NCs per gram of excised organs and tumors at 24 h. All images were obtained by IVIS Lumina III at exposure time: 1 s; binning factor: 4; f number 2, field of view: D-12.5 cm; λex: 680, 700, 720, 740, and 760; λem: 790 nm. Data were analyzed by Living Image 4.3.1 Service Pack 2 software. For the purpose of quantification of curcumin in the tumor, mice were i.v. injected with curcumin-loaded non-DiR labeled NC (16 mg curcumin per kg). 24 h later, tumors were excised, homogenized, and uptake was quantified by flow cytometry. D) Representative histograms and mean fluorescence intensity (MFI). Values are presented as mean ± SD (n = 3), * P < 0.05 (Student's t-test).
