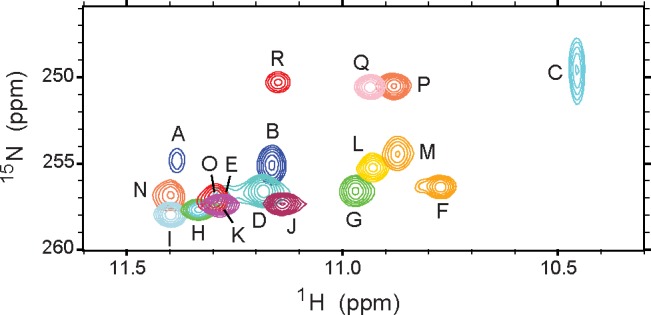
Figure 5.

Overlay of HNN-COSY spectra. Data collected on hemoglobins and holocytochrome b5 at 313 K and apocytochrome b5 at 298 K (peak R). Each cross-peak corresponds to the amide 1H and His 15Nδ1 of an N–H···Nδ1 H-bond, correlated by 2hJNN. The peak labels are defined in the first column of Table 1.
