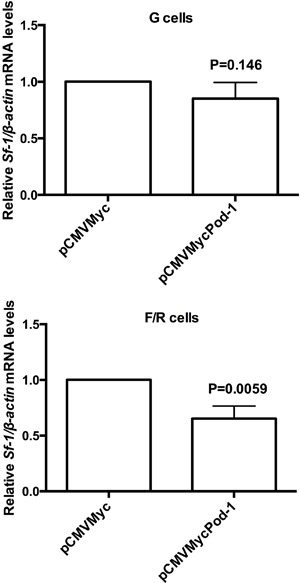
Figure 4. Quantitative reverse transcription PCR (qRT-PCR) analysis of relative Sf-1/ β-actin mRNA levels in primary rat adrenal glomerulosa cells (G cells) and fasciculata/reticularis cells (F/R cells) that had been transiently transfected with the empty vector pCMVMyc or with pCMVMycPod-1. Total RNA samples used in qRT-PCR were prepared 48 h post-transfection. Data are reported as the means±SD of three experiments. Statistical significance was assessed by paired t-tests.

