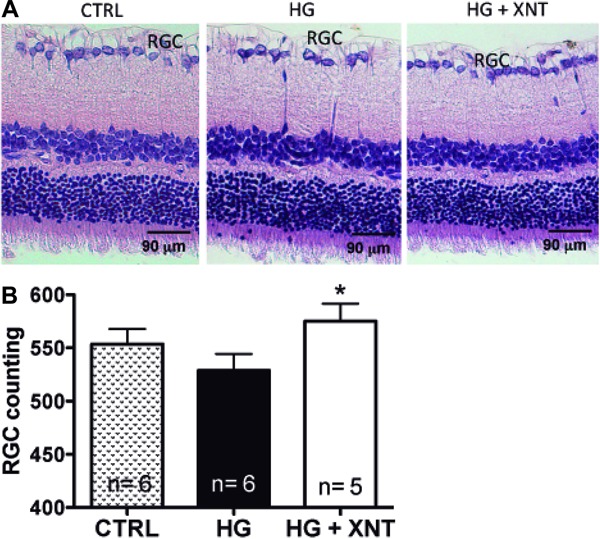
Figure 2. Histological analysis of retinal ganglion cells (RGC). A, Representative photomicrographs of retinas showing RGC in control (CTRL), hyperglycemic untreated (HG), and hyperglycemic XNT-treated (HG+XNT) animals. B, Quantification of RGC in retinas of rats. Note that the treatment with XNT prevented the loss of these cells in HG+XNT rats. *P<0.05 compared to HG group (one-way ANOVA followed by the Newman-Keuls test).