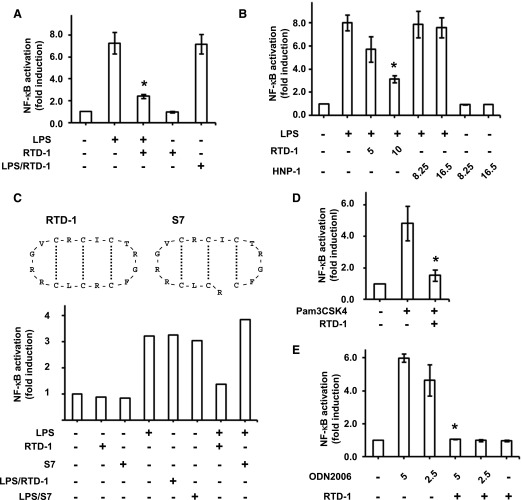
Fig. 3. RTD-1 inhibits NF-κB activation in cells stimulated with TLR agonists.
SEAP activity in the medium of cells stimulated with TLR agonists in the presence or absence of RTD-1 was assayed using Quantiblue. SEAP activity is expressed as fold-induction compared with untreated control cells. (A) Differentiated THP-1 Dual cells were treated with or without LPS (100 ng/ml) in the presence or absence of 10 μg/ml RTD-1. (B) Cells were treated with or without LPS (100 ng/ml) and in the presence or absence of either RTD-1 or HNP-1 (numbers indicate concentrations of RTD-1 and HNP-1 in μg/ml; 2.4 and 4.8 μM correspond to 5 and 10 μg/ml RTD-1 and 8.25 and 16.5 μg/ml HNP-1, respectively). (C, upper panel) The structures of RTD-1 and S7 peptide; the dotted lines indicate disulfide linkages. (C, lower panel) THP-1 Dual cells were stimulated with 100 ng/ml LPS in the presence or absence of 10 μg/ml RTD-1 or the acyclic S7 peptide. One out of 2 independent experiments is shown. (D) Differentiated THP-1 Dual cells were treated with Pam3CSK4 (25 ng/ml) in the presence or absence of 10 μg/ml RTD-1. (E) HEK-Blue hTLR9 cells were treated with or without ODN2006 (ODN) and ±10 μg/ml RTD-1. The numbers indicate the concentration of ODN2006 in μg/ml. Results are shown as means ± sd from 3 independent experiments. *P < 0.05 when compared with treatment with agonist alone.

