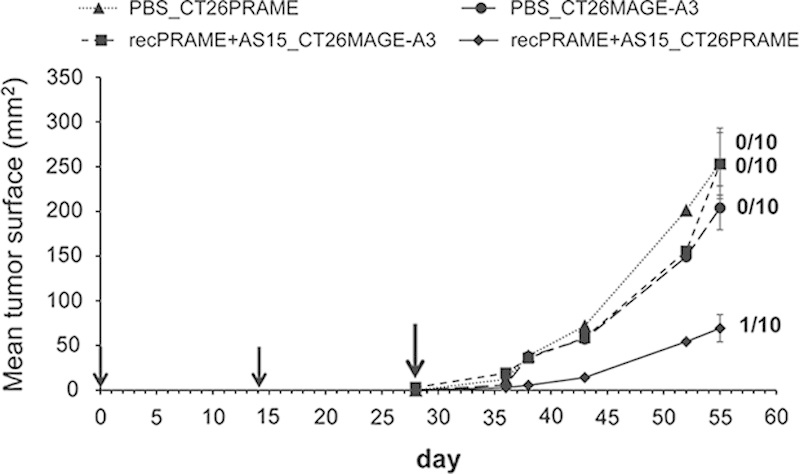
FIGURE 5.

The specificity of tumor protection in CB6F1 mice induced by 2 injections of recPRAME+AS15. Mean tumor sizes at the last time point in each group: (A) recPRAME+AS15_CT26PRAME, 69.3 mm2; recPRAME+AS15_CT26MAGE-A3, 253.0 mm2; phosphate-buffered saline (PBS)_CT26PRAME, 253.7 mm2; PBS_CT26MAGE-A3, 203.9 mm2. Statistically significant differences in mean tumor sizes were observed between groups: recPRAME+AS15_CT26PRAME versus recPRAME+AS15_CT26MAGE-A3, P<0.0001; recPRAME+AS15_CT26PRAME versus PBS_CT26PRAME, P=0.0010; recPRAME+AS15_CT26PRAME versus PBS_CT26MAGE-A3, P=0.0003. Data are expressed as a mean tumor size of 10 mice per group. Error bars represent SEs. Black arrows represent the injection time points. The last black arrow indicates the tumor challenge time point. Numbers of tumor-free mice among the 10 mice included in the analysis per group at the last time point of assessment are indicated. PBS_CT26PRAME indicates mice injected with PBS, challenged (at day 28) with PRAME-expressing tumor cells; PBS_CT26MAGE-A3, mice injected with PBS, challenged (at day 28) with MAGE-A3-expressing tumor cells; recPRAME+AS15_CT26MAGE-A3, mice injected with recPRAME+AS15, challenged (at day 28) with MAGE-A3-expressing tumor cells; recPRAME+AS15_CT26PRAME, mice injected with recPRAME+AS15, challenged (at day 28) with PRAME-expressing tumor cells.
