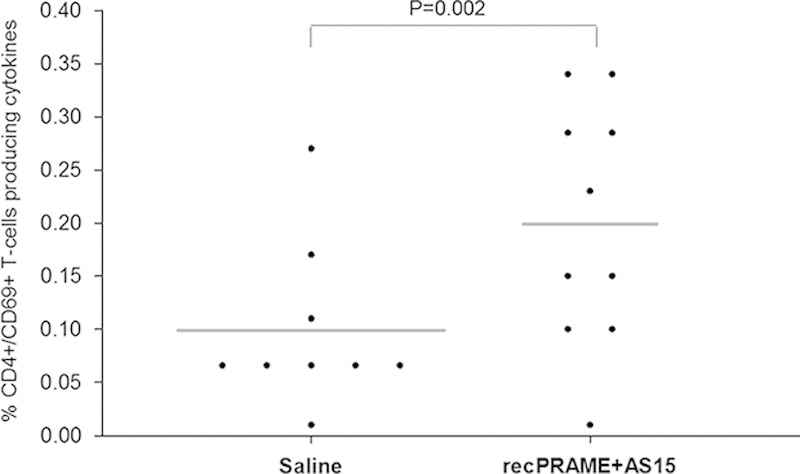
FIGURE 6.

The percentage of T cells (CD4+ and CD69+) producing cytokines in Cynomolgus monkeys injected with saline or recPRAME+AS15 at postdose 7. Dots represent individual percentages of T cells producing cytokines. The horizontal bars represent mean values. recPRAME+AS15 indicates monkeys injected with recPRAME+AS15; Saline, monkeys injected with saline.
