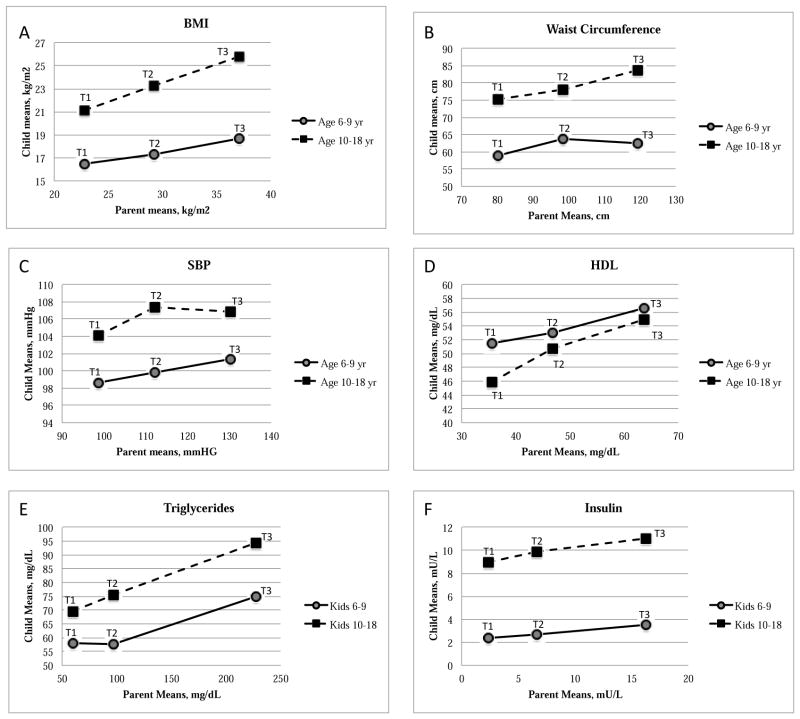
Figure 2.
Parents were grouped into tertiles for each risk factor. Children were assigned to the same tertile as their parents, regardless of their own risk factor values. The mean of the children within each parent tertile was plotted against the corresponding parent tertile mean. Pictured here are the child means within parent tertiles for BMI (A), waist circumference (B), SBP (C), HDL-C (D), Triglycerides (E) and Insulin (F). T1=1st tertile, T2=2nd tertile and T3=3rd tertile.

