Fig. 3.
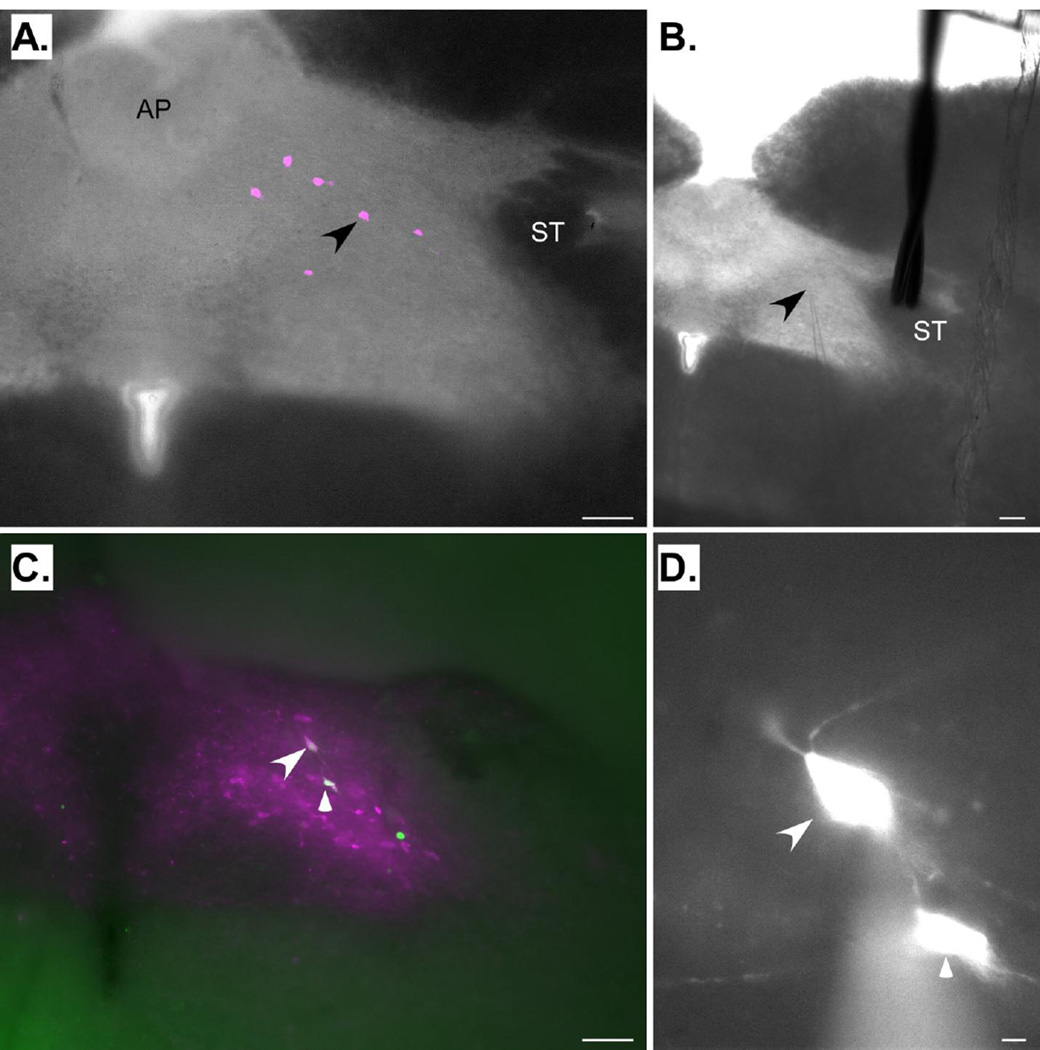
A and B. Photomicrographs showing a section from the cNST at the level of the area postrema (AP), the region where most cNST neurons were recorded. Panel A shows a photomicrograph of a fixed section taken after recording. Six neurons filled with Lucifer Yellow (pseudocolored magenta) are apparent. The arrowhead indicates the location of the neuron being recorded in panel B. Panel B shows a photomicrograph of the same section taken during recording. The arrow indicates the tip of the recording pipette. Note the position of the stimulating electrode on the solitary tract (ST). C. Photomicrograph of a fixed, dopamine-beta hydroxylase-(DBH) stained cNST section taken subsequent to recording. This section was caudal to the area postrema. The arrows indicate two Lucifer Yellow-filled (pseudocolored green) neurons that are double-labeled for DBH (magenta). D. Higher-power photomicrograph of the neurons indicated in C taken during the preparation. Scale bars: 100µm in A, B, & C; 10µm in D.

